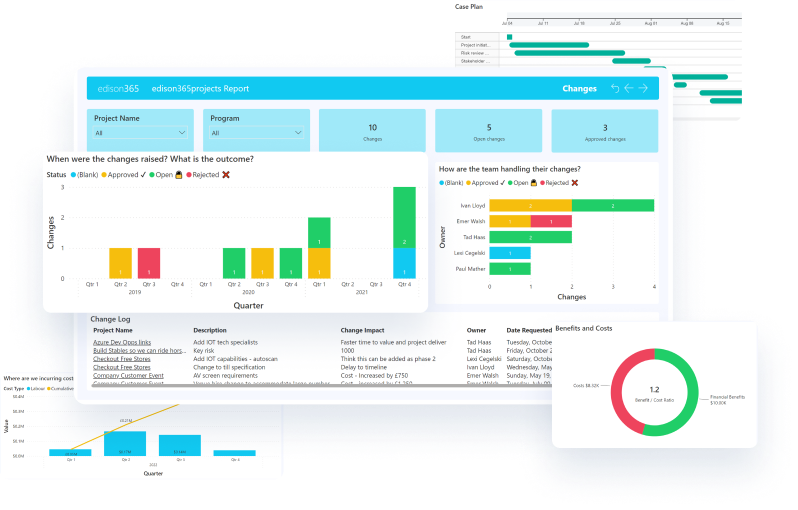
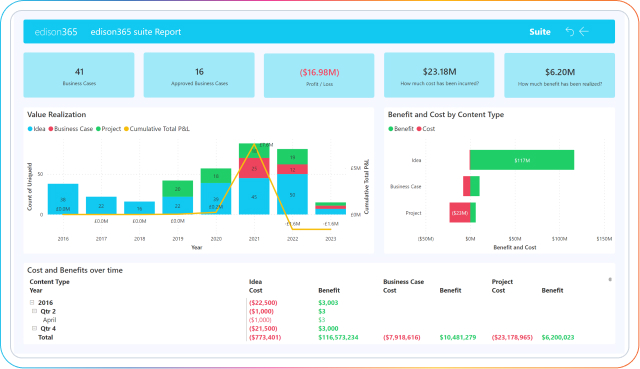
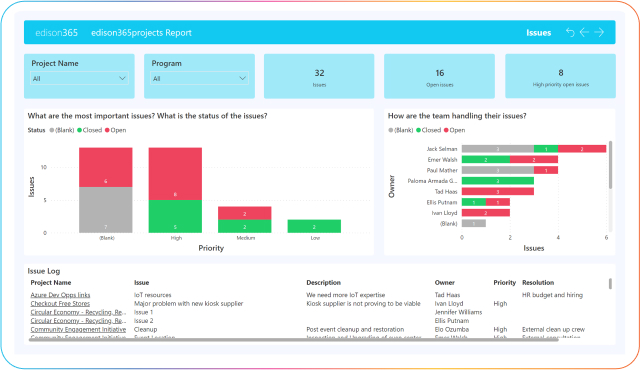
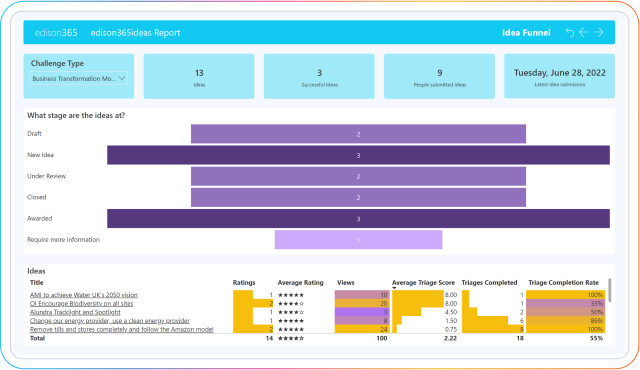
Access real-time data in edison365 and supercharge decision-making with insightful reporting dashboards at every stage of your business transformation journey.


Customize your inputs and enhance your reports with stunning visuals. From tracking task statuses to revenue summaries, you’re a filter away from organized data. Making it easier to understand and present the bigger picture.
Reporting in edison365 makes it easier to see your north star! Dive deep into the data to identify what’s causing bottlenecks and prevent hold-ups; whilst also monitoring costs and how it’s changing over time.


By default, edison365 uses Power BI for robust reporting dashboards. And with interactive graphs and fully configurable layouts, your data will be easy to read. Not sold on Power BI? Choose your preferred reporting API to connect with edison365.
Leverage template reports and uncover insights from day one with edison365
Clarify the impact you’re making and the benefits you’ve unlocked with reporting
Build modular reports and filter everything from project title, type, costs, success rate and much more
“edison365 was the only platform we found that had a nice design, that was young and fun to work with, along with being part of our existing Microsoft ecosystem.”
“We identified $1 Million of lost revenue per annum through the collection of ideas submitted through edison365ideas. That was within the first few months of turning the system live and so we’re excited for what other impactful ideas are put forward in the future.”
“Using Edison365 makes it possible to bring in ideas for our organization quickly for all the employees.”
In edison365, you’re in the driving seat! You can create dynamic reporting dashboards using any data in the platform. Whether it’s tracking the surge of submitted ideas, the journey of business cases through their various stages, pinpointing identified risks, gauging resource capacity, or unveiling the costs and benefits across your entire portfolio – the possibilities are boundless. Your data, your canvas, your insights await!
By default, edison365 uses Power BI. However, you can use your preferred reporting API tool to pull data from the platform.
Of course. While Power BI templates are provided as a quick and easy way to get started, you can build your own! And for those complex dashboards, our friendly professional services team can help with personalized templates that match your needs!
You can explore our different licensing options here.
Get in touch with our friendly team for all things business transformation
Get in touch with our friendly team for all things business transformation
See exactly how edison365 helps business transform with a free trial
Register your interest to join our partner program and discover new ways to grow your business!
